We're pleased to bring you our first installment of our new graphics package. This is the latest evolution of MWIS to bring a new angle to our much-valued service.
We will be using these on our social media content, plus we hope to soon add them to our regional forecast pages as icons, all with the aim of helping to more effectively communicate some of the main hazards in the mountain forecast.
These will compliment our forecast text, serving to draw attention to expected conditions in an eye-catching and relatively whimsical manner, whilst providing an informative safety message about the severity which may be experienced.
We hope this will help to convey the basics of the forecast for those who are maybe new to the mountains, or those who may simply respond better to visual prompts rather than just a bank of text.
It's important to point out that these images will NOT replace our existing content - our descriptive human-written forecasts remain the core of MWIS.
Our forecasts very much rely on readers to use a level of personal judgement about how to manage the conditions - what is severe for one person is an everyday encounter for another. Hopefully the imagery will serve to give a first point of contact for the key messages in forecasts, encouraging you to find out more information where necessary. If they act as an attention-grabber, the graphics will serve their purpose.
We've extensively researched and planned this project, with the idea of turning our most common forecast wording into graphics - a picture paints a thousands words as they say...
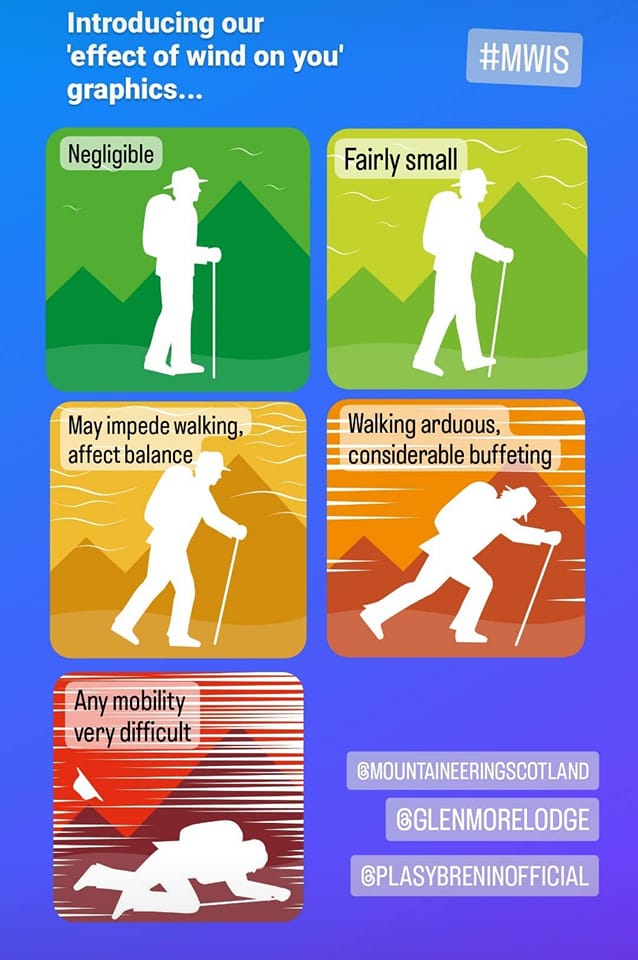
The MWIS wind graphics will relate to the wording from our 'effect of wind on you' section of the forecasts. Regular followers of MWIS will know this broadly escalates from negligible, through buffeting and right up to mobility near-impossible!
To allow for changes in relative severity, either from region to region or season to season, we won't necessarily attribute a fixed speed range to each icon, (although see the images below for a general guide). For example, a summer gale with much lower winds speeds than a winter storm may equally use the same top end graphics, because of the likelihood of less-experienced people or families being on the hills.
Wind speed on the hills is often vastly overestimated by the walker - assuming you have been in a speed much higher than the actual value.
Broadly, anything above 20-25mph will affect balance, over 30-35mph becomes very strenuous, whilst over 40-50mph becomes difficult and gusts may blow you over. For anyone who has genuinely experienced 60mph+ on the hills, it is incredibly difficult to maintain any stance or mobility - even experienced professionals resorting to crawling to sheltered ground.
Different weather situations also bring different 'types' of wind - sometimes constant, sometimes very gusty or squally. There are times where the strongest winds will not be on the summits - surging gusts through passes and to lower slopes.
We'll be sharing these more via our social media posts in weeks ahead, so do let us know there what you think.
A quick comment on our human 'character' - we went round a few designs trying to be as neutral as possible, but with understandable difficulty. Our next batch of designs will have an additional persona, so watch this space!
We will be soon adding graphics for general weather, navigation and other hazards to our collection - stay tuned for those...
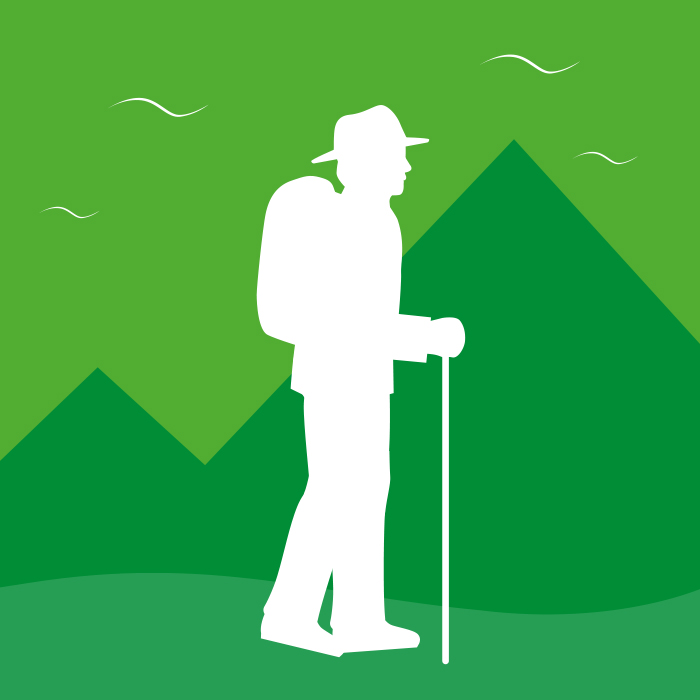
Under 10-15mph
Negligible
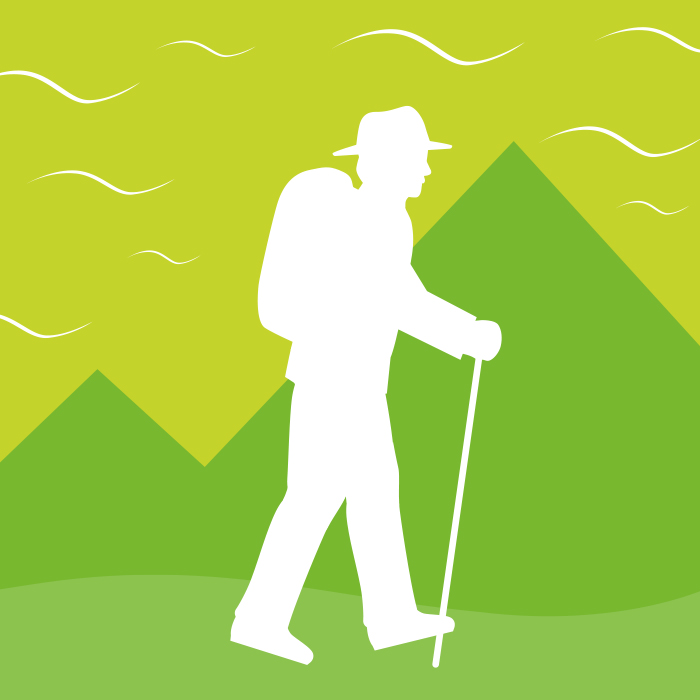
10-15 to 20-25mph
Fairly small, wind may begin to inconvenience walking.
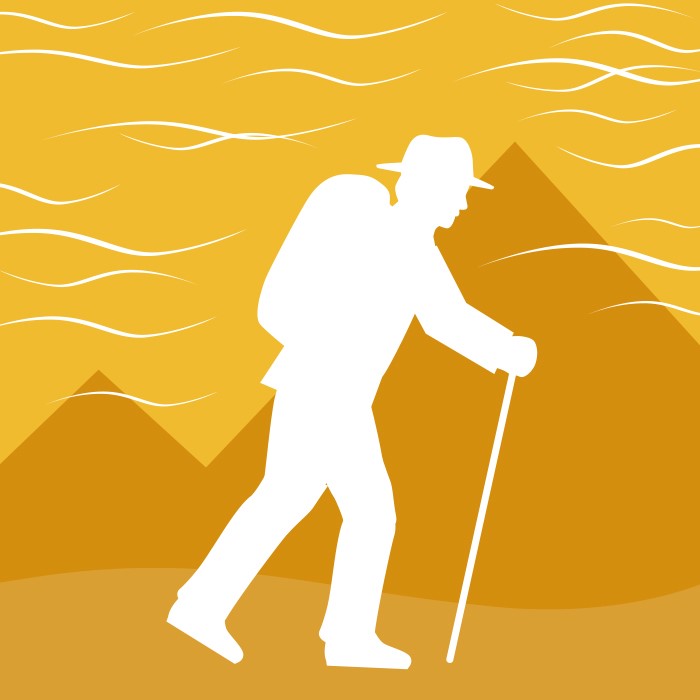
20-25 to 30-35mph
Likely impede ease of walking, affecting balance, some buffeting gusts.
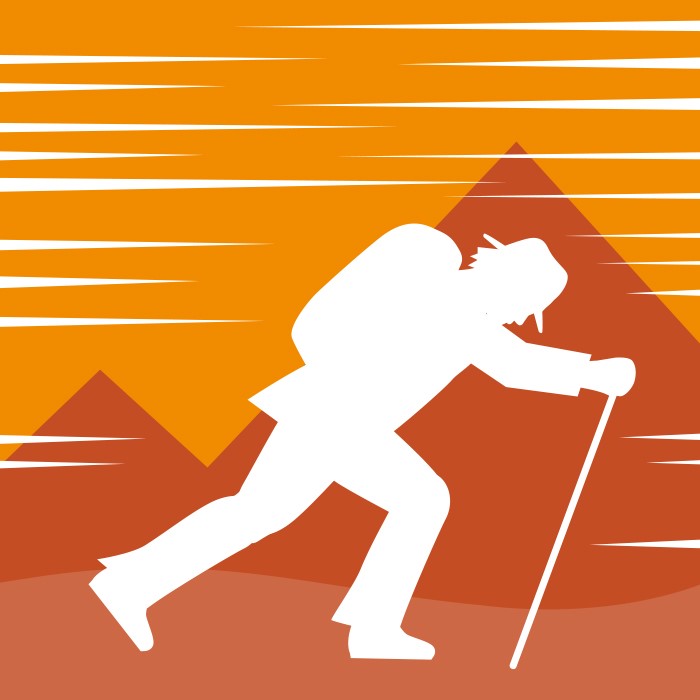
30-35 to 45-55mph
Walking strenuous or increasingly arduous, considerable buffeting, stronger gusts may knock you off your feet.
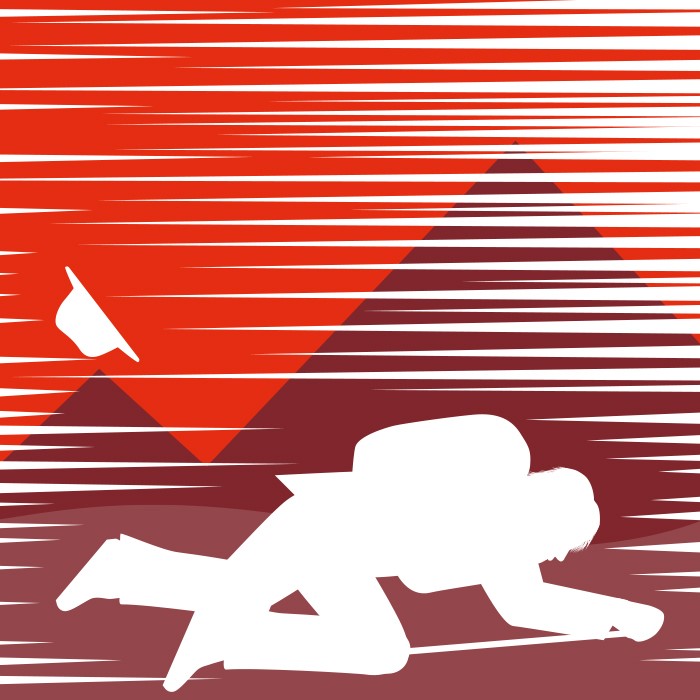
50-60mph+
Very difficult conditions. Any mobility challenging, tortuous, becoming near-impossible as speeds rise. Powerful gusts can knock you over.