A combination of temperature, density and pressure
Many of you may have heard of the '528 line' when forecasting snow. It appears on synoptic charts and heralds some wintry weather ahead. But what is this magical line all about?
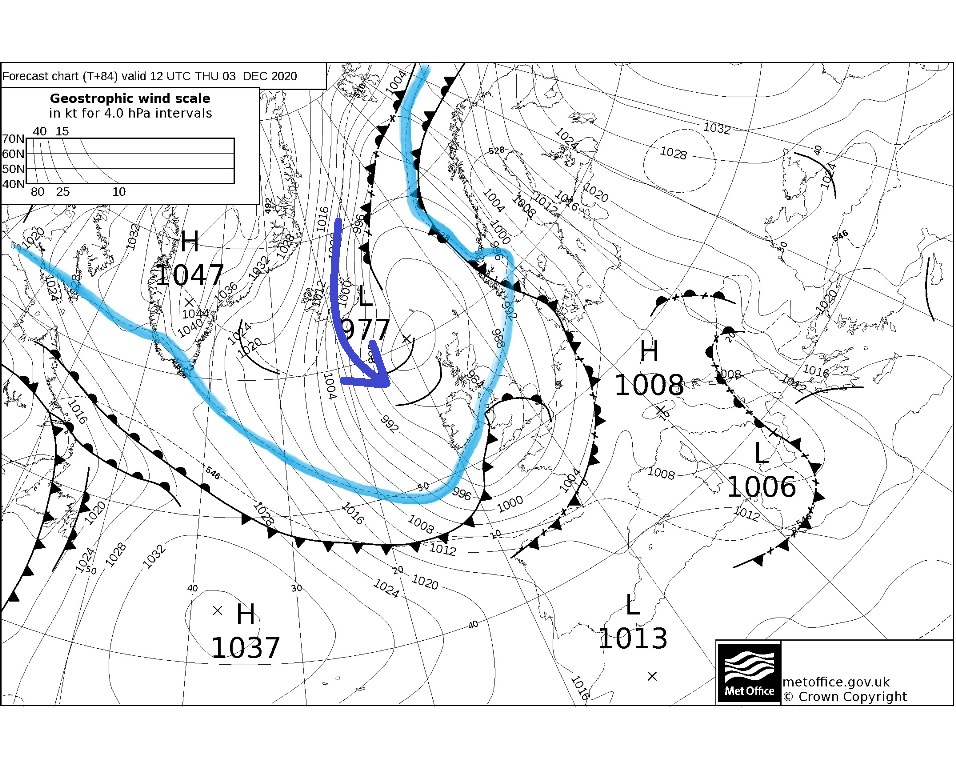
Almost imperceptible on a standard synoptic chart, lurking among a melee of isobars, there are some dotted lines too. You'll have to look closely to find a '528' marker! I've highlighted this line in blue. Maybe easier to spot is a line with a '546' label visible, which lies over the mid-Atlantic. Above is the forecast chart for this Thursday, which is when the 528 line makes an appearance across our shores.
We're very familiar with isobars on weather maps, they are lines of constant pressure, and give us the highs and lows which are the bread and butter of understanding the weather patterns. But what about these extra lines?
These are constant height lines, often referred to as 'thickness' lines, in this case referring to the depth of the layer of atmosphere up to 500mb. Pressure falls with increasing height in the atmosphere. (Millibars are sometimes used interchangeably with hectopascals (hPa) in scientific studies - they conveniently work out as the same thing!)
'528' is a value in ''decameters' - add an extra zero for meters. So, 5280m above the surface.
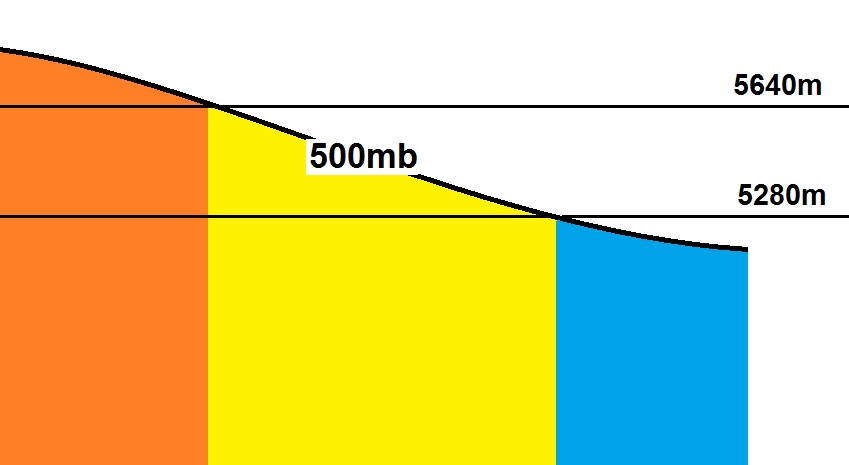
The lower the 'thickness', the colder the air mass. Colder air is more dense than warm air so it occupies less space. Hence the sketch here, which shows how the 500mb level varies with changing temperatures. 528 is simply a rule of thumb for a 'polar' airmass, '564' would be 'tropical' air, and brings very warm or heatwave conditions for the UK.
Such pressure levels are standard practice in meteorology, and their use stems from aviation. On our planning videos, we sometimes show the 850mb temperatures, which are a handy reference for UK mountain top temperatures. 850mb being typically found at 1200 to 1500m elevation.
The charts below show the forecast temperatures at these corresponding levels on Thursday. At 500mb, we're widely below -30C (perfectly normal for a cold wintry spell), whilst lower down in the atmosphere at 850mb, we're between -4 and -7C. The '120' on the white background is 1200m, so we'd expect our highest Scottish summits to be around the -6C mark on Thursday.
Another forecasting rule of thumb, is that when 850mb is at -5C or lower, there is a greater than 50% chance of snow to sea level (other factors such as precipitation intensity and humidity come into play too).
500mb chart
850mb chart
As far as the mountains are concerned, who cares about sea level?! We're dealing with snow in the forecast long before the lowlanders are reaching for their shovels!
The freezing level is another important aspect of forecasting the snow line. This Thursday's chart suggests it is widely sub-zero above 600m, whilst in the Highlands values of 200-400m means it's a freezing day from most low levels upwards.
Often these charts can underestimate the 0C level on the mountains, so bear that in mind too.
Many indications are favouring low freezing levels and a cold air mass remaining with us well into next week at least, as weather patterns shift into a very wintry mode. Some forecast models are more 'optimistic' than others, but there is very much scope for significant snowfalls ahead, even to low levels. Stay tuned!